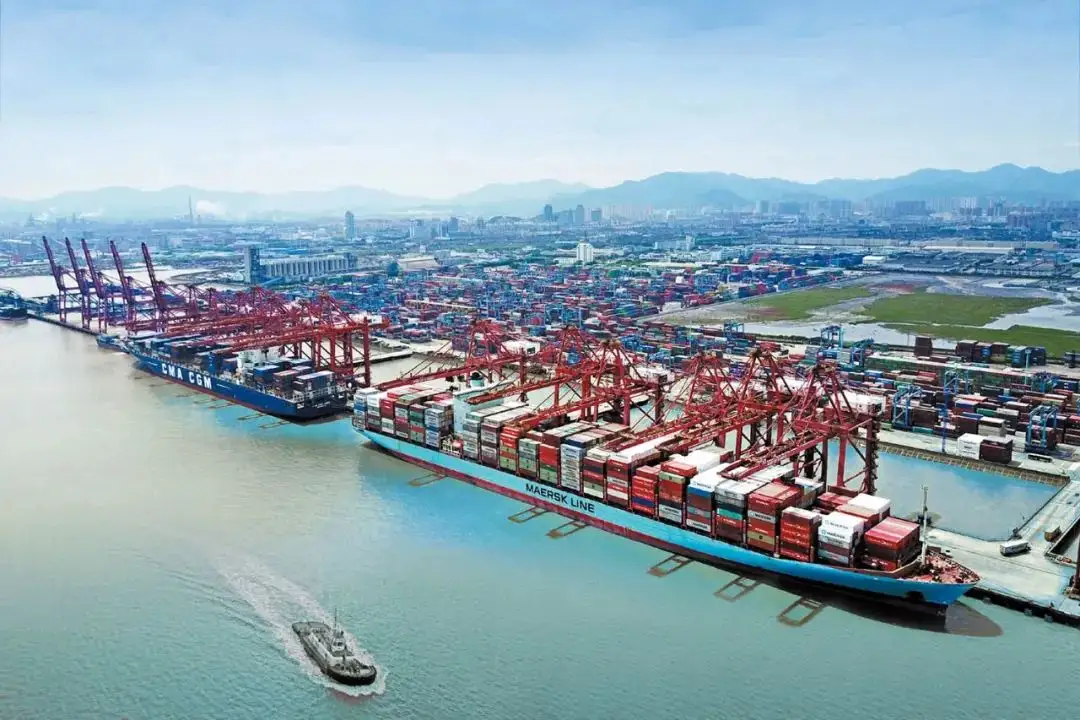
Container shipping prices are the fees carriers charge to move standardized containers on ocean routes, and they move weekly—sometimes daily. As of 22 October 2026, the benchmark Drewry World Container Index (WCI) stands at about US$4,585 per 40ft container, up 2% week on week and the highest reading in 15 weeks—roughly double its 9 April 2026 low of US$2,309. Behind that number: firm US import demand keeping the transpacific near its peak plateau, a first Asia–Europe increase after 13 consecutive weekly declines, and carriers still managing capacity with blank sailings. If you import from China, the practical takeaway is simple: treat published rates as a moving reference, know which container size and which cost lines you are actually comparing, and get a current, itemized quote before you book.

What Drives International Container Shipping Prices in 2026?
No single factor sets a freight rate. Container shipping prices are the product of supply and demand for vessel space, the cost of moving that space, and the risk of the route itself. Below is how each driver is moving prices right now, and what we are actually seeing from our desk in Shenzhen.
| Driver | How it moves prices | What is happening as of October 2026 |
|---|---|---|
| Vessel supply & capacity management | More ships and empty slots push rates down; carriers counter by canceling sailings (“blank sailings”) to hold rates up | A record wave of roughly 10 million TEU of new capacity delivered between 2024 and 2026 is being partly offset by blank-sailing programs. Drewry’s cancelled-sailings tracker (16 Oct 2026) counts 44 blank sailings across weeks 43–47 out of 713 planned, a 6% cancellation rate on East–West trades. For the week after 22 Oct, only two blank sailings are announced on the transpacific (down from six) versus eight on Asia–Europe (up from two)—capacity was being pulled from Europe to protect transpacific rates |
| Fuel costs | Marine fuel (VLSFO) is a large operating cost, recovered through base rates or fuel formulas (BAF/LSS) | Energy prices spiked after the February 2026 Gulf conflict and remain elevated, keeping the fuel component of rates structurally high and the BAF line visible on almost every 2026 quote |
| Geopolitics & rerouting | Closed or risky waterways force longer routings, absorbing capacity and adding cost | Carriers are steadily returning to the Suez Canal: Lloyd’s List Intelligence counted 1,228 Suez transits in September 2026—the busiest month since December 2023, still about 39% below pre-crisis levels. Maersk and Hapag-Lloyd have moved the AE5, AE11 and ME2 services back to Suez, the AE12/SE1 Asia–Mediterranean service follows from 27 October, and CMA CGM has announced a full Suez return in December. Risk has not disappeared: on 7 October a CU Lines boxship was fired on in the southern Red Sea. In the Gulf, only two containerships sailed in during week 42, down from five the week before |
| Seasonality & demand pull-forwards | Peak season (roughly August–October) and pre-holiday stocking lift demand | 2026 demand was pulled forward by US tariff deadlines and retailer restocking, compressing the traditional curve. The post-Golden Week lull took the WCI down 2% on 8 October to $4,351 before cargo flows resumed and it rebounded to $4,485 (15 Oct) and $4,585 (22 Oct) |
| Equipment & port congestion | Empty-container shortages and terminal delays add surcharges and lengthen cycles | Chinese export congestion has eased sharply: average vessel waiting time at Shanghai fell from 97 hours in week 38 to 38 hours in week 42 (Drewry). On the Panama side the drought measures were relaxed on 28 September—Neopanamax draft restored to 49 ft and a tenth daily Neopanamax slot added for bookings from 15 October—but carrier Panama surcharges of US$100–130 per TEU remain in force on Asia–US East Coast and Gulf services |
| Contract timing | Carriers push rate increases (FAK/GRI) ahead of tender rounds | Asia–Europe and Mediterranean 2027 contract negotiations have started. Carriers pushed FAK levels of US$4,500–4,800 per 40ft on Asia–Europe from 19 October; Drewry judged implementation uncertain given the capacity returning through Suez |
The common thread in 2026 is that carriers are using capacity discipline to protect rates even as huge amounts of new tonnage enter the water. That is why a price can stay high on one trade lane while softening on another in the same week—and why you should never budget a Chinese export shipment off a single index number.
READ MORE:
- Shipping From China to the USA
- Shipping From China TO Canada
- Shipping From China TO Mexico
- Shipping From China to Panama
- Shipping From China to Costa Rica
- Shipping From China to Brazil
- Shipping From China TO Colombia
- Shipping From China to Jamaica
- Shipping From China to Venezuela
- Shipping From China to Argentina
Container Shipping Prices Now: China Export Lane Snapshot (October 2026)
Below are the benchmark numbers we verify before advising clients. Spot rates are port-to-port quotes from Shanghai; they exclude origin and destination handling, surcharges, duties and inland delivery, and they change weekly—so treat them as a reference, not a quotation.
Benchmark indices
| Index | Latest value | As of | What it tells you |
|---|---|---|---|
| Drewry World Container Index (WCI), composite | US$4,585 / 40ft container | 22 Oct 2026 (weekly) | Global spot benchmark across 8 East–West routes; +2% on the week, the highest reading in 15 weeks, and about 2x the 9 Apr 2026 low of US$2,309 |
| Shanghai Containerized Freight Index (SCFI), composite | 3,679.58 points | 16 Oct 2026 (weekly) | Chinese official export-market gauge; +15.47 points (+0.42%), the second consecutive weekly gain. Reweighted on 16 Oct—see the caution below before comparing it with older prints |
| Freightos Baltic Index (FBX), Asia–US West Coast | US$8,126 / FEU | 20 Oct 2026 | Independent forwarder-based index; held level week on week while daily prints firmed on slow-season capacity cuts |
| China Containerized Freight Index (CCFI) | 1,922.64 points | 16 Oct 2026 | Includes contract as well as spot rates, so it lags the spot indices—useful for seeing where long-term contract levels sit |
Indicative spot rates from Shanghai (Drewry WCI, 22 Oct 2026)
| Lane | 40ft spot (US$) | 20ft equivalent (US$) | Weekly change | What is moving it |
|---|---|---|---|---|
| Shanghai → Los Angeles | ~$8,007 | ~$4,400–5,600 (derived) | +2% | Strong US import demand; only two transpacific blank sailings announced for the week after 22 Oct |
| Shanghai → New York | ~$10,166 | ~$5,600–7,100 (derived) | +1% | SCFI puts the US East Coast 40ft at $10,405; Panama Canal surcharges of $100–130 per TEU still apply |
| Shanghai → Rotterdam | ~$3,632 | $2,335 (SCFI Europe 20ft, 16 Oct) | +3% | First rise after 13 weekly declines; carriers pushing FAK $4,500–4,800 per 40ft from 19 Oct |
| Shanghai → Genoa | ~$4,152 | $3,250 (SCFI Med 20ft, 16 Oct) | +5% | Mediterranean 20ft rose 8.3% on the week and now sits at 78% of the 40ft rate—20ft equipment is tight in the Med |
How the 20ft figures were produced. A 40ft container normally prices at only 20–40% above a 20ft on the same lane, so a 20ft rate typically lands at 55–70% of the 40ft level. Where SCFI publishes a 20ft number (Europe and Mediterranean) we quote it directly; where it does not (the US lanes), we mark the range as derived from that ratio. The spread matters: on the Mediterranean this week the actual ratio is already 78%, which is what “20ft equipment tight” looks like in a price table.
Sources: Drewry World Container Index, 22 Oct 2026 assessment; Shanghai Shipping Exchange, SCFI 16 Oct 2026; Freightos Baltic Index, week to 20 Oct 2026; Lloyd’s List Intelligence transit counts and carrier service advisories as cited above.
How to read SCFI and WCI for budgeting
Two indices dominate rate discussions, and they answer different questions. The Drewry WCI is a weekly index of spot rates across eight major East–West routes, published every Thursday—use it to see where the market is this week and to time a booking against a GRI. The SCFI, published weekly by the Shanghai Shipping Exchange, is the official Chinese view of spot prices out of Shanghai—use it as the reference your Chinese supplier and forwarder will recognize. Neither index is a quotation: real offers add origin and destination charges, surcharges and the forwarder’s margin. When a number in a news headline or a supplier email has no date attached, ask for the date before you treat it as current.
One technical caution for 2026: on 16 October the Shanghai Shipping Exchange reweighted the SCFI basket and began publishing 40ft (FEU) indices for Europe, the Mediterranean, Santos and Manzanillo. The Europe 20ft series dropped from 20% of the composite to 5%, a new Europe 40ft lane carries 15%, and US West Coast 40ft moved from 20% to 17.5%. In plain terms, a composite reading from before 16 October is not directly comparable with one after it, and any 40ft quote benchmarked against a pre-October Europe 20ft figure was being compared to a different product.
What the numbers show now is a market with two speeds. The transpacific is holding near its peak plateau: Shanghai–Los Angeles at $8,007 (WCI) and $8,126 (FBX), with US import demand still firm. Asia–Europe has turned off the bottom: Freightos put Asia–North Europe at $3,442 per FEU (+6%) and Asia–Mediterranean at $3,927 (+3%) in the week to 20 October, driven by pre-tender GRIs, while Transatlantic sits at about $2,850 per FEU—$200 higher than late September and 25% above a year ago. Industry expectation, as reported by Taiwan’s MoneyDJ, is that North Europe spot rates hold around US$2,900–3,200 per FEU through the second half of October.
For route-level detail and cost breakdowns, see our guides to container shipping costs from China to the USA, the cost of shipping a 40ft container from China to the USA, container shipping costs from China to the UK, or read how much is ocean freight from China for the full cost picture.
How Much Does It Cost to Ship a Container? 20ft vs 40ft vs 40HQ
This is the question behind most “container shipping cost” searches, and the honest answer has three parts: the size of the box, the lane, and the date. Container size changes the price less than most importers expect, while changing the cost per cubic metre dramatically.
| Container | Usable volume | Max payload | Typical share of the 40ft rate | Best for |
|---|---|---|---|---|
| 20ft GP (20DV) | ~33 CBM | ~28,000 kg | 55–70% | Dense, heavy cargo—ceramics, machinery, metals—where weight, not volume, is the limit; small first orders |
| 40ft GP (40DV) | ~67 CBM | ~26,500 kg | Baseline (100%) | General cargo, furniture, retail and mixed palletized freight |
| 40ft High Cube (40HQ) | ~76 CBM | ~26,500 kg | Roughly the same as 40GP, sometimes 8–12% more | Light, bulky goods: textiles, e-commerce, tall racking and pallets |
Why the 40ft wins on cost per CBM. A 40ft carries roughly twice the volume of a 20ft for 20–40% more money, so the unit cost halves. On this week’s transpacific numbers a 20ft works out to roughly $133–170 per CBM against about $120 per CBM for a 40ft; on Rotterdam the gap is even wider, with a 40ft at roughly $54 per CBM against around $71 per CBM for a 20ft. The exception is weight-limited cargo: once you hit the payload ceiling, extra volume buys you nothing and the 20ft becomes the rational choice.
| Lane (from Shanghai) | 40ft spot | 20ft spot | 40ft cost per CBM | 20ft cost per CBM |
|---|---|---|---|---|
| → Los Angeles | $8,007 | ~$4,400–5,600 | ~$120 | ~$133–170 |
| → New York | $10,166 | ~$5,600–7,100 | ~$152 | ~$170–215 |
| → Rotterdam | $3,632 | $2,335 | ~$54 | ~$71 |
| → Genoa | $4,152 | $3,250 | ~$62 | ~$98 |
These are ocean-freight-only figures per container, calculated on nominal usable volume (~67 CBM for a 40ft, ~33 CBM for a 20ft). Fill only half the box and your real cost per CBM doubles—which is exactly why the decision has to be made on your actual cargo volume, not on the headline rate.
So which should you book? Under about 15 CBM, LCL is usually cheaper because you only pay for the space you use—see LCL vs FCL for small cargo and current LCL shipping rates from China to USA. Between roughly 15 and 30 CBM, a 20ft is normally the cheapest FCL option. Above about 30 CBM, or with light bulky goods, a 40ft or 40HQ wins on every measure. For heavy cargo that exceeds the 40ft payload limit, two 20ft containers are the only compliant option.
One more distinction that changes the number more than container size ever will: port-to-port versus door delivery. Every figure above stops at the arrival port. Add export clearance, ocean, destination clearance, duty and inland trucking and you are at landed cost—our door-to-door DDP service exists precisely to turn those pieces into one number, and our China to UK and China to US region pages explain what is available on each side.
Why the Same Lane Shows a Different Price on Different Sites
Importers regularly find US$2,300 for China–Europe on one site and US$4,600 on another, then conclude one of them is lying. Almost always the difference is definitional. Five things explain nearly every discrepancy:
- The unit. A 20ft container is a TEU, a 40ft is an FEU. SCFI quotes Europe and the Mediterranean in TEU and both US coasts in FEU, so its $2,335 Europe figure and $10,405 US East Coast figure were never comparable. Doubling a TEU number to make an FEU number is the single most common benchmarking error we see.
- The scope. “Ocean freight” can mean base rate only, base rate plus BAF/PSS, or fully all-in to the destination port. 2026 quotes bundle surcharges in different ways, so an all-in $4,600 and an ocean-only $4,100 can describe the same booking.
- The date. Any figure without a date is worthless in this market. The WCI composite moved $4,351 → $4,485 → $4,585 across three consecutive Thursdays (8, 15 and 22 October 2026). An article quoting the September level understates today’s price on Asia–Europe by close to 10%.
- Index versus quotation. Indices are assessed averages for base ports, before THC, documentation, detention and forwarder margin. A carrier quote for your specific gate, commodity and validity window will differ in both directions.
- Methodology changes. SCFI was reweighted on 16 October 2026 and gained new 40ft lane indices. Two “SCFI” numbers published either side of that date measure slightly different baskets—one more reason to compare dated, same-scope figures only.
| Index | Publisher | Unit & coverage | Best used for |
|---|---|---|---|
| WCI | Drewry (private) | US$ per 40ft, 8 East–West lanes from Shanghai, weekly (Thursday) | Timing a booking; tracking week-to-week direction on major lanes |
| SCFI | Shanghai Shipping Exchange (official) | Points, composite plus lane rates in TEU/FEU, weekly (Friday) | The reference your Chinese supplier and forwarder recognize |
| FBX | Freightos (marketplace-based) | US$ per FEU, forwarder-transacted lanes, weekly with daily prints | Cross-checking whether a move is real or a single carrier’s push |
| CCFI | Shanghai Shipping Exchange | Points, spot plus contract | Where contract levels sit versus the spot market |
Practical rule: benchmark with an index, then buy with an itemized quote for your exact lane, container and validity window. If a supplier sends you a rate without a date, a unit and a scope, ask for all three before you build a budget on it.
What’s Inside a Container Shipping Quote in 2026?
The rate you see quoted is rarely just “ocean freight.” A 2026 quote typically stacks a base rate plus surcharges, and understanding each line is the fastest way to compare two quotes fairly.
| Line item | What it covers | Typical notes (2026) |
|---|---|---|
| Base ocean freight (FAK or contract rate) | Moving the container from origin to destination port | FAK = “freight all kinds,” the standard spot tariff; on Asia–Europe carriers were pushing FAK of $4,500–4,800 per 40ft from 19 October 2026 |
| GRI (General Rate Increase) | Periodic carrier rate increases, often effective the 1st of a month | If your quote has a validity window, confirm whether a pending GRI applies |
| PSS (Peak Season Surcharge) | Added demand during peak season | Common on the transpacific in Q3–Q4; check whether the October level is already included |
| BAF / LSS (bunker adjustment / low-sulphur surcharge) | Fuel cost recovery | Often bundled into “all-in” rates; ask whether it is separate or included |
| Panama Canal surcharge (Asia–US East Coast/Gulf) | Recovery of canal restrictions and slot limits | US$100–130 per TEU still in force on Asia–US East Coast and Gulf cargo even after the 28 September easing; confirm the current level with your forwarder |
| Origin charges (THC, export docs, trucking, VGM) | Handling at the Chinese port, customs documents and inland haulage | Depends on Incoterms: under FOB the buyer still pays these in the final landed cost |
| Destination charges (DTHC, ISPS, AMS/ENS) | Terminal handling, security and customs filings at arrival | AMS (US) / ENS (EU) filings are small but easy to miss |
| Cargo insurance | Cover for loss or damage in transit | Typically a small fraction of insured value; see the example below |
| Duties, VAT and import clearance | Taxes and brokerage at destination | Country- and HS-code-specific; never include these in “ocean freight” comparisons |
| Environmental cost pass-through | EU ETS and similar carbon costs on EU-bound cargo | The EU shipping ETS phase-in reaches 100% of verified emissions in 2026, so expect a visible carbon line on Europe-bound quotes |
Example: what a US$10,000 shipment actually costs. Suppose you ship a 40ft container of consumer goods from Shenzhen to Rotterdam in late October 2026, spot booking:
| Cost component | Example amount (USD) |
|---|---|
| Goods value (EXW) | $10,000 |
| Inland trucking + origin handling in China | $450 |
| Ocean freight, Shanghai → Rotterdam (WCI spot, 22 Oct 2026) | $3,632 |
| Destination THC + customs brokerage | $500 |
| Cargo insurance (~0.3% of insured value) | $45 |
| Total before import duty and VAT | $14,627 |
Import duty and VAT are excluded because they depend on your commodity’s HS code and the destination country—in the EU, VAT alone commonly runs 19–25%. Use this only as a budgeting illustration; the DDP shipping option can bundle most of these into one fixed price.
How to read a quote line by line. A short checklist we give every client: (1) ask for an all-in breakdown rather than one round number; (2) confirm the validity date and whether any GRI/PSS is pending; (3) verify which costs sit on the seller’s side vs. yours under your Incoterms—for a clear explanation see our guide to FOB Incoterms; and (4) put the itemized lines into your booking contract. Any charge that is not itemized in the quote should be questioned in writing before you confirm.
FCL vs LCL: Why the Pricing Logic Is Different
Container shipping prices are quoted in two completely different units, and mixing them up is a common budgeting mistake:
- FCL (Full Container Load) — priced per container (20ft or 40ft). You pay for the box, so the per-unit cost falls as you fill it; the 20ft rate is lower than the 40ft rate per box, though rarely lower per cubic metre.
- LCL (Less than Container Load) — priced per cubic meter (CBM) plus a CFS handling fee for consolidation at origin and deconsolidation at destination. You pay only for the space you occupy, which is why LCL is the default under about 15 CBM.
As a rule of thumb, if your cargo reaches roughly 15 CBM, FCL usually becomes more economical and faster than LCL—the crossover many forwarders quote runs between 12 and 15 CBM depending on the lane. For one shipment of 8 CBM, LCL almost always wins. And with a 20ft currently carrying about $133–170 per CBM on the transpacific versus an all-in LCL rate that also has to fund consolidation and deconsolidation, the break-even moves in FCL’s favour the moment your volume is predictable.
Want the details? See what is LCL and FCL in shipping, compare LCL vs FCL for small cargo, and check current LCL shipping rates from China to the USA or shipping costs from China to the USA for route numbers.
Spot vs Contract Rates: How to Buy Ocean Freight in a Volatile Market
In a market moving as fast as 2026’s, when and how you buy matters as much as the price itself.
| Spot rate | Contract (annual/quarterly) rate | |
|---|---|---|
| What it is | Current market price for immediate booking | Agreed rate for a committed volume over a period |
| Pros | Flexible, no volume commitment | Locks a level below spot spikes; protects peak-season budgets |
| Cons | Exposed to GRI and peak-season jumps | If rates fall, you may pay above market |
| Best for | One-off or low-volume shipments | Regular, predictable volumes |
A practical strategy that works for most SME importers:
- Commit what you can predict. If you ship monthly, put roughly 60–70% of volume on a contract with a review clause (quarterly is safer than annual in this market), and keep the rest on spot for flexibility.
- Time your bookings around the calendar. Chinese New Year (January–February 2027) pulls cargo forward for 3–4 weeks beforehand; Golden Week in October and US retail peak create similar windows. Book space 3–4 weeks ahead of these crunches, not one week.
- Watch GRI timing—and the tender calendar. Carriers announce rate increases in advance, usually effective the first of a month, and they push hardest before Asia–Europe tender rounds. 2027 contract negotiations are already under way, which is why the October FAK push happened at all.
- Use a forwarder who has direct carrier contracts. A licensed forwarder buys at wholesale levels and can compare spot vs. contract on your behalf—this is where most of our clients save money.
Choosing that partner is itself a skill—our guide on how to choose the right freight forwarder covers what to check in credentials, network and pricing transparency.
Container Shipping Rate Outlook: Q4 2026 into 2027
We do not do forecasts; freight rates are too event-driven. What we do is track the variables and present scenarios, so you can plan for each. A short timeline of what already moved prices in 2026 explains why the scenarios below matter:
- February 2026 — The US–Iran conflict disrupts the Strait of Hormuz; energy prices and war-risk premiums jump, lifting the cost base for every route out of Asia.
- 9 April 2026 — The WCI composite bottoms at US$2,309 per 40ft container, the low from which the current level is roughly double.
- June 2026 — The official SCFI composite averages 3,018.26 points (+35.9% month-on-month) as US-bound rates surge on tariff-driven pull-forwards.
- 28 September 2026 — The Panama Canal Authority relaxes drought measures: Neopanamax draft back to 49 ft and a tenth daily Neopanamax slot from 15 October, for 33 daily transits. Carrier Panama surcharges stay in place.
- 8 October 2026 — Post-Golden Week lull: WCI falls 2% to $4,351.
- 15–16 October 2026 — WCI rebounds 3% to $4,485, the first Asia–Europe rise after 13 weekly declines; SCFI prints 3,679.58 and is reweighted with new 40ft lanes.
- 19–22 October 2026 — Carriers push FAK of $4,500–4,800 per 40ft on Asia–Europe; the WCI rises another 2% to $4,585, a 15-week high, with Shanghai–Los Angeles at $8,007.
| Variable | If it pushes rates UP | If it pushes rates DOWN | What to watch |
|---|---|---|---|
| Suez / Red Sea reopening | A new security incident reverses the return of services | Returning capacity releases what Cape routings absorb; full normalisation is projected for Q1 2027 and is the main 2027 downside risk | Weekly Suez transit counts (1,228 in September 2026, still ~39% below pre-crisis); carrier service announcements; CMA CGM’s December full return |
| Red Sea security | Attacks such as the 7 October CU Lines incident keep war-risk premiums and Cape routings alive | A durable calm lets carriers accelerate the Suez shift | Advisories from carriers; war-risk surcharge notices |
| Panama Canal | A dry season reimposes draft and slot limits on US East Coast and Gulf services | The 28 September easing holds and surcharges soften through Q4 | ACP advisories; carrier Panama surcharge levels ($100–130 per TEU) |
| Blank sailings & capacity management | Carriers keep pulling sailings to defend the October increases | 44 blank sailings across weeks 43–47 (6% of planned capacity) is modest—easy to unwind if demand cools | Drewry’s weekly cancelled-sailings tracker |
| Newbuild deliveries (~10M TEU, 2024–2026) | Slow steaming and scrapping absorb the surplus | Structural oversupply pressures rates once peak season ends | Fleet utilization data |
| 2027 contract season | Pre-tender GRIs stick and lift the contract floor | Forwarders are sceptical the October FAK push holds against rising capacity | Whether the $4,500–4,800 Asia–Europe FAK levels survive into November |
Our base reading for Q4 2026: transpacific container shipping prices stay firm and volatile into the end of peak season on US import demand and tight capacity management; Asia–Europe’s rebound is the more fragile of the two, because it rests on pre-tender GRIs while Suez capacity returns; and into 2027 the biggest risk to high rates is the sheer volume of new capacity—unless geopolitical disruption keeps absorbing it. For importers, that argues for locking the predictable part of Q1 2027 volume now, before the Chinese New Year squeeze, and keeping the rest flexible.
How Dantful Helps You Manage Container Shipping Costs
Dantful International Logistics is a Chinese Class-A freight forwarder founded in Shenzhen in 2008, holding NVOCC, FMC and Jctrans credentials. Because we book directly with the shipping lines, we see carrier GRIs and capacity changes in real time—and we pass that visibility to you with Ocean Freight quotes that are itemized, current and valid for a stated window.
What that means in practice: one contact who tells you whether a spot booking or a contract makes sense for your lane and volume, a recommendation on container size based on your actual CBM and weight rather than on what is easiest to sell, daily tracking updates with photos through the shipment, and 24/7 support when a blank sailing or a typhoon delays your cargo. Send us your cargo details through our contact page and we will respond with a market-based quote and a clear breakdown of every line on it.
FAQs
How much does it cost to ship a container overseas?
As of late October 2026, port-to-port spot rates from Shanghai run about $4,400–5,600 for a 20ft and $8,007 for a 40ft to Los Angeles, $5,600–7,100 for a 20ft and $10,166 for a 40ft to New York, $2,335 for a 20ft and $3,632 for a 40ft to Rotterdam, and $3,250 for a 20ft and $4,152 for a 40ft to Genoa. Add origin and destination charges, duty and inland delivery to reach door-to-door landed cost.
How much does a 20ft container cost compared with a 40ft?
A 40ft normally costs only 20–40% more than a 20ft on the same lane, so a 20ft rate typically lands at 55–70% of the 40ft figure—despite carrying roughly half the volume. That is why the 40ft is almost always cheaper per cubic metre. The exception is dense, heavy cargo that would exceed a 40ft payload limit, where the 20ft is the correct and often cheaper choice overall.
Why do container shipping prices change every week?
Because they track vessel supply and demand in real time. Carriers adjust base rates through GRIs, add or remove peak-season surcharges, and change capacity with blank sailings—so a rate quoted in week one can differ in week two. The WCI moved from $4,351 to $4,485 to $4,585 across three consecutive Thursdays in October 2026.
Will container shipping prices fall in 2026 or 2027?
Rates have just risen for two consecutive weeks, so not in the short term. Asia–Europe is bouncing off a 13-week decline as carriers push pre-tender GRIs, though returning Suez capacity may cap it; the transpacific is holding near its peak plateau on US import demand. The structural wildcard into 2027 is the roughly 10 million TEU of new capacity delivered in 2024–2026, which pressures rates as soon as demand softens or Suez normalises.
How much is a 40ft container from China to the US West Coast right now?
As of 22 October 2026 the Drewry benchmark for Shanghai to Los Angeles is about US$8,007 per 40ft container, spot and port-to-port. SCFI put the US West Coast 40ft at $7,525 on 16 October and the Freightos FBX at $8,126 on 20 October. Our guide to the cost of shipping a 40ft container from China to the USA breaks that figure down line by line.
Why do two freight sites show different prices for the same lane?
Usually three reasons: unit (20ft TEU versus 40ft FEU), scope (ocean-only versus all-in to the destination port), and date (a September figure versus a late-October one). Index methodology changes add a fourth—SCFI was reweighted on 16 October 2026. Always compare dated numbers with the same unit and the same inclusions.
What do GRI and PSS mean on my freight quote?
GRI (General Rate Increase) is a carrier-wide base-rate increase, typically effective on the 1st of a month. PSS (Peak Season Surcharge) is a temporary charge during high-demand periods. Always confirm whether a pending GRI applies to the validity window of your quote.
How far ahead should I book before Chinese New Year?
Book 3–4 weeks before the holiday rush, because exporters in China front-load cargo and vessel space fills quickly. Chinese New Year falls in January–February 2027, so Q1 space—and any 2027 contract level—is better negotiated in Q4 2026 than in January. The same applies to Golden Week in October and the US retail peak.
Is a spot rate or an annual contract better for me?
If you ship monthly with predictable volume, a contract with a quarterly review protects you from peak spikes; keep 30–40% on spot for flexibility. If you ship occasionally, spot is usually simpler. In the current rebound, a contract signed now is only good value if the level sits below where spot is likely to be in Q1 2027—which is what a forwarder with direct carrier contracts can actually tell you.
How is LCL priced compared with FCL?
LCL is priced per cubic meter plus a consolidation fee; FCL is priced per container. Around 15 CBM (some forwarders say 12), FCL generally becomes the cheaper and faster option.
What charges can be added after a quote?
Origin and destination terminal handling, AMS/ENS security filings, peak-season and fuel surcharges, Panama Canal surcharges, demurrage and detention, and destination clearance are the usual additions. Ask for an all-in itemized quote with a validity date so you can compare offers fairly.
Can a freight forwarder get me a better rate than booking directly?
Often yes. A licensed forwarder with direct carrier contracts buys at wholesale levels, combines volume across clients, and can tell you when a contract beats the spot market—something most importers cannot see from the outside.
For current rates and advice on your specific trade lane, contact Dantful International Logistics today—our team ships from China to 200+ countries and answers around the clock.

Young Chiu is a seasoned logistics expert with over 15 years of experience in international freight forwarding and supply chain management. As CEO of Dantful International Logistics, Young is dedicated to providing valuable insights and practical advice to businesses navigating the complexities of global shipping.